
Intro
In today’s world, productivity and efficiency undoubtedly are key indicators of career success. However, having breaks now and then throughout the workday are essential for maintaining physical and psychological well-being. Planning rest on their work day, people rely on their habits and subjective feelings, not backed by biological measurements, and often chose a task-driven approach, instead of the body-driven one. The research of work breaks is complicated due to not homogenous designs and experimental methods (Scholz et al., 2019). Nonetheless, it has been established that a short rest, up to 10 minutes, allows employees to partially restore their psychological and cognitive resources required for task-solving (Bennett et al., 2019). Having a universal type of relaxing activity during work breaks remains doubtful (Scholz et al., 2018), but these breaks are undeniably important.
The Productivity function of the Waverox Mind Tracker BCI app allows determining the most favorable time for work and rest. It is built on the basic principles of the pomodoro system but also considers the individual’s state, based on electroencephalogram (EEG) signals. The algorithm determines the degree of a so-called accumulated fatigue real-time, which is implied by a combination of several EEG metrics, including fatigue score, alpha gravity, and concentration index. Fatigue score is the ratio of alpha and theta rhythms spectral power density sum to the beta rhythm. This metric is traditionally considered a fatigue indicator (Jap et al., 2009), associated with inability to concentrate, which, in its turn, was demonstrated in the studies of car drivers (Jing et al., 2020). Alpha gravity represents the ratio of the spectral power density to alpha rhythm sub-bands, while concentration index determines the degree of an individual’s concentration on a specific task and is calculated as the ratio of the spectral power density of beta rhythm to alpha rhythm (Freeman et al., 1999; Grammer et al., 2021).
The aim of this study was to confirm that the Mind Tracker BCI Productivity tool is effective in optimizing work flow.
Materials and Methods
EEG Registration and Respondents
The study involved 26 healthy respondents (average age 34.59±5.7, mean ± SD), working as managers, lawyers, analysts, logisticians, and accountants, both at the office and remotely. Respondents were selected, based on their reports on experiencing constant stress, high workload and concentration, as well as processing a large amount of information associated with their work. The respondents started out the study by filling in a short questionnaire with questions about their work schedule and how they personally plan breaks throughout the workday.
EEG was recorded by the Waverox Headband device with dry electrodes through four channels – O1, O2, T3, T4, the sampling rate was 250 Hz. Comparing the signal quality of Waverox Headband with Muse Headband and professional EEG recording equipment, Waverox dry electrode technology proved overall consistency with medical-grade measurement standards.
Experiment Design and Data Processing
Respondents were to come to the office with their own laptops and spend their workday under researchers’ supervision. Respondents’ brain activity was continuously recorded during the entire working day. The groups of 5–7 respondents were working in a room, but each respondent could leave the room during their breaks if they wanted. The study included two groups of subjects: one worked with the Productivity tool, determining the duration of their work sessions and breaks. The control group chose the time and duration of their rest by themselves. Break activities were not restricted. The total duration of the study, including equipment setup and calibration, was 6 hours, from 10:00 to 16:00.
When analyzing the data, EEG metrics comparison was conducted separately for all work sessions and breaks. To accomplish this, continuous EEG recording for each subject was divided into the parts corresponding to work and breaks, which were subsequently combined into two separate records containing data on brain activity during all work sessions and all rest periods. For comparison we used standard statistical tests.
Findings and Discussion
Respondents and Their Subjective Impressions about the Study
According to the survey conducted, study participants spent an average of 42.05±6.9 hours a week (mean ± SD) working, with 53.8% of respondents not having a standardized work schedule. Moreover, all respondents reported occasionally working overtime, including on weekends. Only 61.5% adhered to a clear work plan, while others preferred to improvise. Furthermore, over 70% of respondents reported regularly putting off tasks until the deadline, hesitating to start a new task, procrastinating, getting absorbed in tasks up to skipping meals, while 65.7% of the subjects identified themselves as workaholics.
The most common feedback from using the Mind Tracker BCI Productivity tool was insufficient work sessions and breaks; the respondents wanted to spend more time working and then take a longer break.
Average Rest and Work Time
For the group using Productivity tool, the average rest time was 8.25±1.7 minutes, and the work session lasted 27.41±4.0 minutes. On average, during the 6-hour work period, they took 6.7 breaks. In the control group, the average rest time was 20.08±5.3 minutes, and the work time amounted to 86.67±14.8 minutes. On average, they took 3.3 breaks.
Changes in Electroencephalogram Metrics
Figure 1 shows the change in average fatigue parameter values in respondents during the entire work and rest period. The Mann-Kendall statistical test was used to establish data trends. The graphs show different duration of work and break time for the two groups due to differences in their work process restrictions.
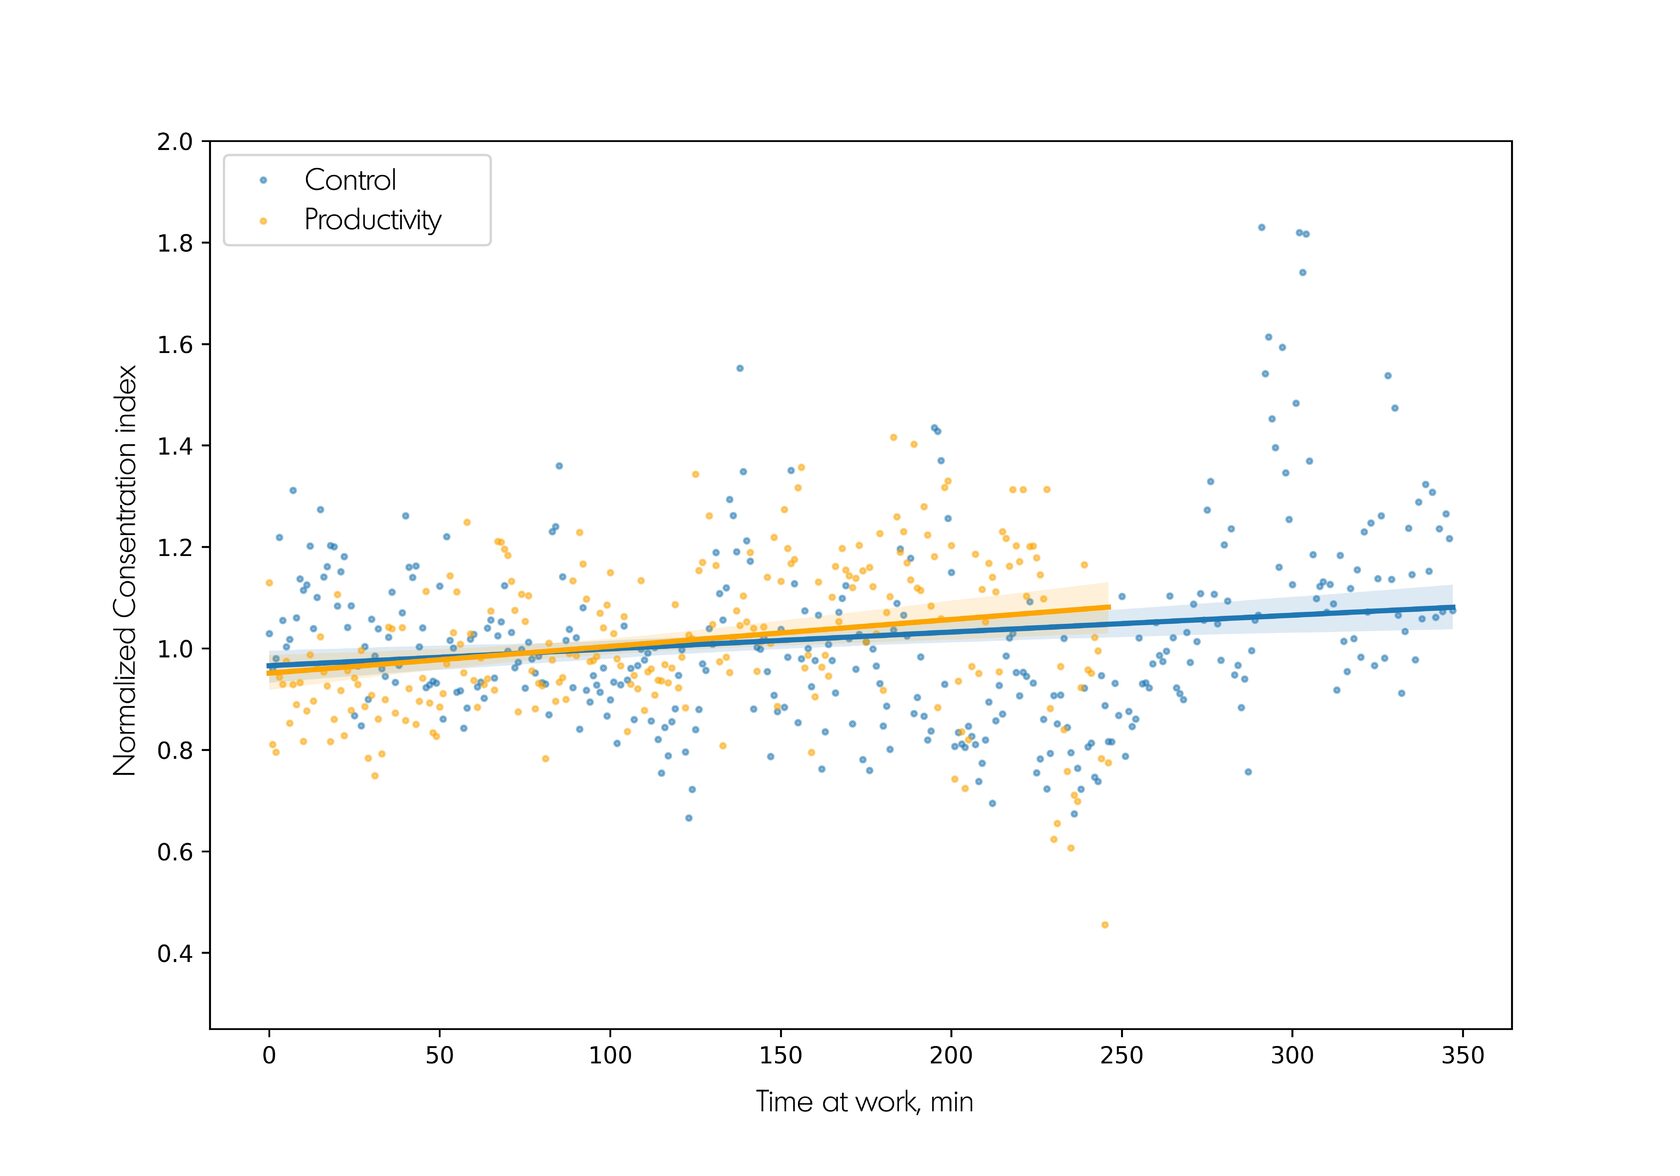
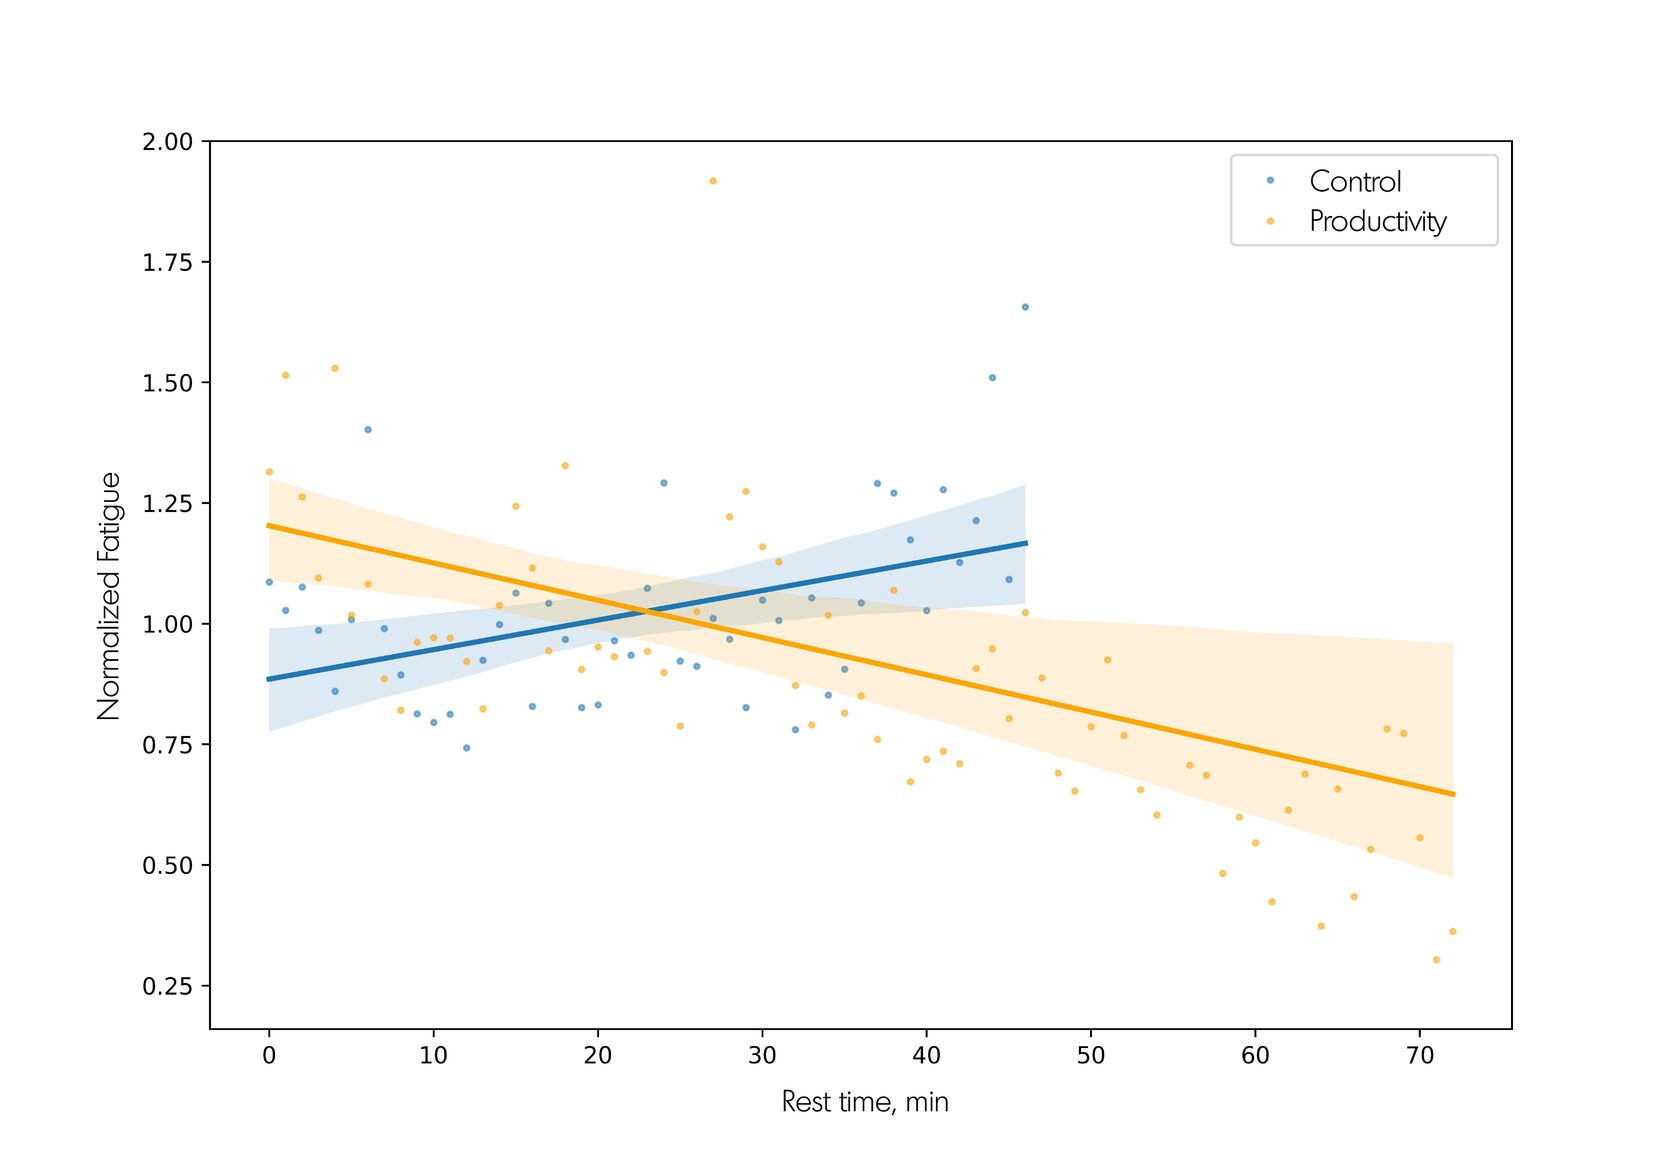
Figure 1. Changes in the fatigue parameter throughout the sequence of all work periods (A) and breaks (B). The dots represent the average group parameter values for each minute. The lines correspond to linear regression, the area around them, highlighted in color, represents the 95% confidence interval.
Both groups showed a decrease in the fatigue parameter throughout the entire work session (z = -5.696, p<0.001 and z=-7.2945, p<0.001 for the control and Productivity groups, respectively). However, the Productivity group exhibited a more pronounced decline. Additionally, the Productivity group showed decrease in the fatigue parameter during rest (z=-7.205, p<0.001), while no significant changes were detected in the control group. This suggests that the Productivity group experienced less fatigue from monotonous work and remained more focused and concentrated on the task throughout the entire study.
The increased engagement in the work process in the Productivity group is also backed by changes in the concentration index, as shown in Figure 2.
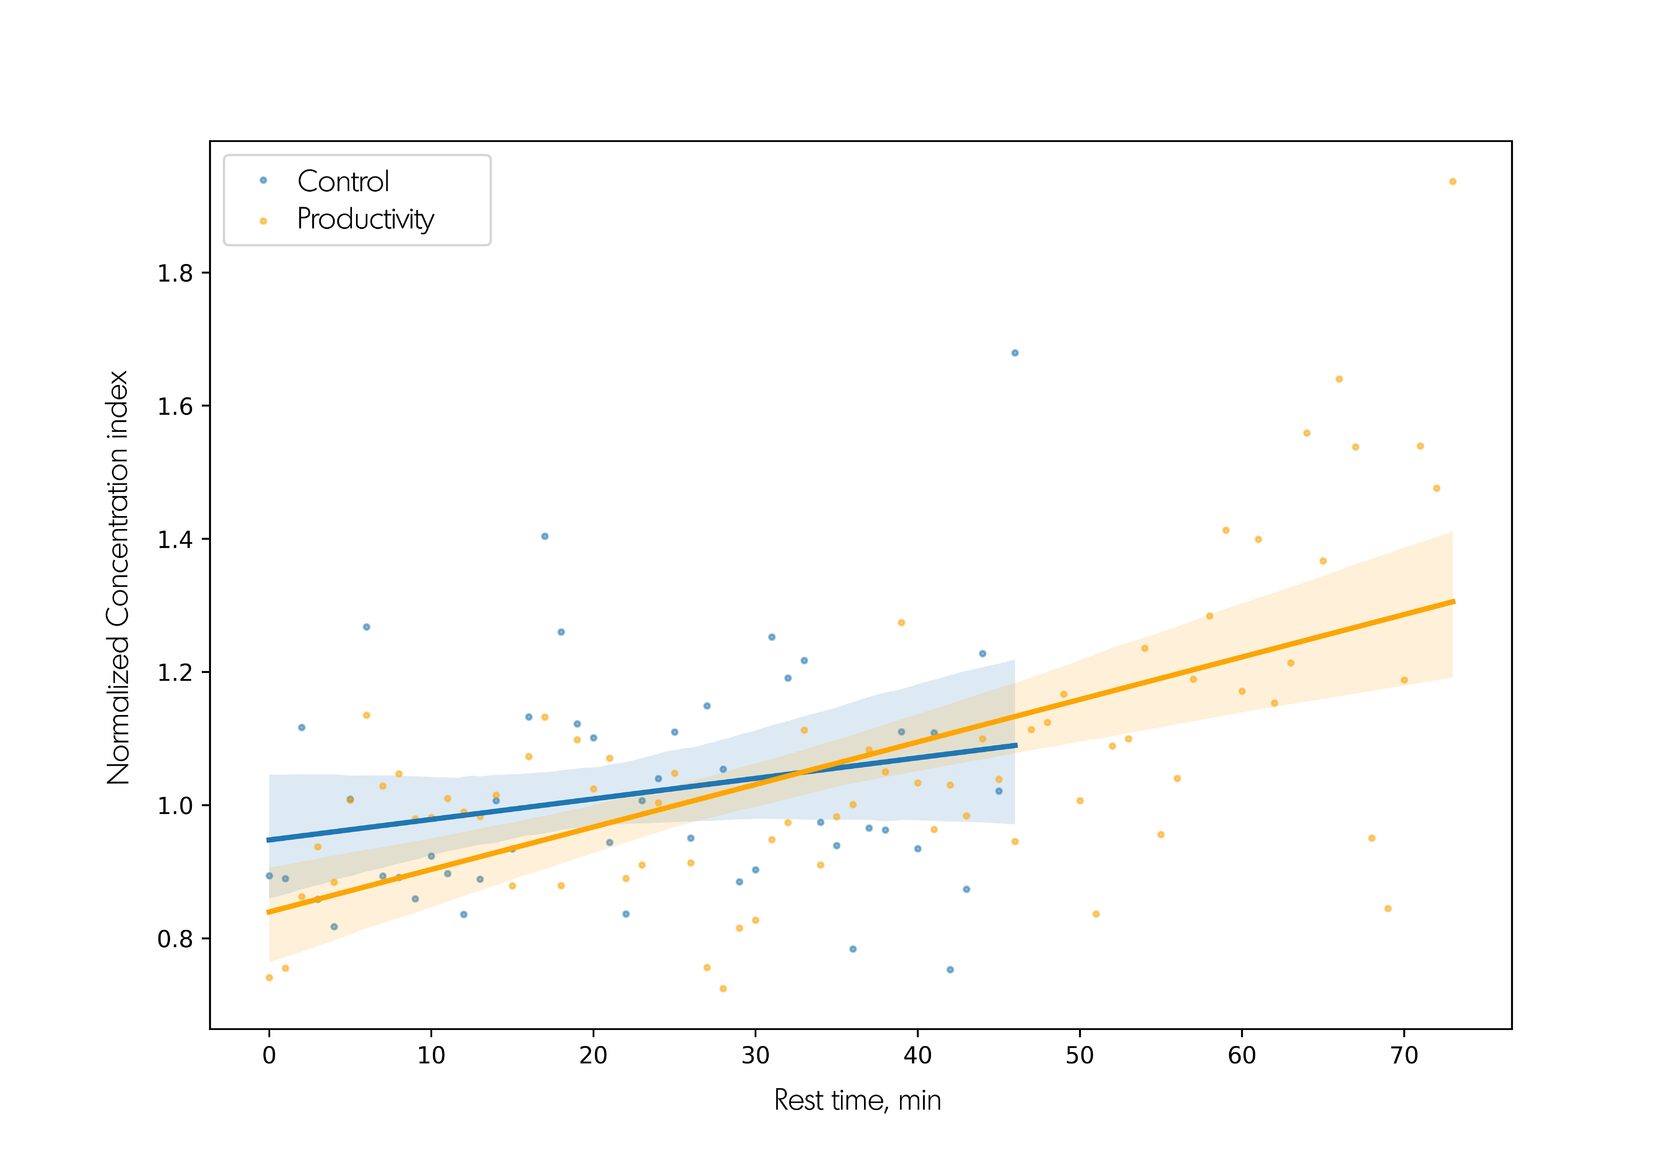
Figure 2. Changes in the concentration index throughout the sequence of all work periods (A) and breaks (B). The dots represent the average group parameter values for each minute. The lines correspond to linear regression, the area around them, highlighted in color, represents the 95% confidence interval.
An increase in the concentration index was only shown in the Productivity group (z = 5.571, p<0.001 for work time and z=5.544, p<0.001 for breaks), while no significant changes were detected in the control group.
Another metric observed during the study was the cognitive score (Fig. 3). This metric reflects an individual’s cognitive load, and it is calculated, based on the individual alpha peak frequency (Bazanova & Aftanas, 2008). With iAPF<10Hz, it is a ratio of beta rhythm power spectral density to the sum of alpha and theta rhythms power spectral density. With IAPF>10Hz, it is calculated as a ratio of upper alpha range spectral density to lower alpha range spectral density.
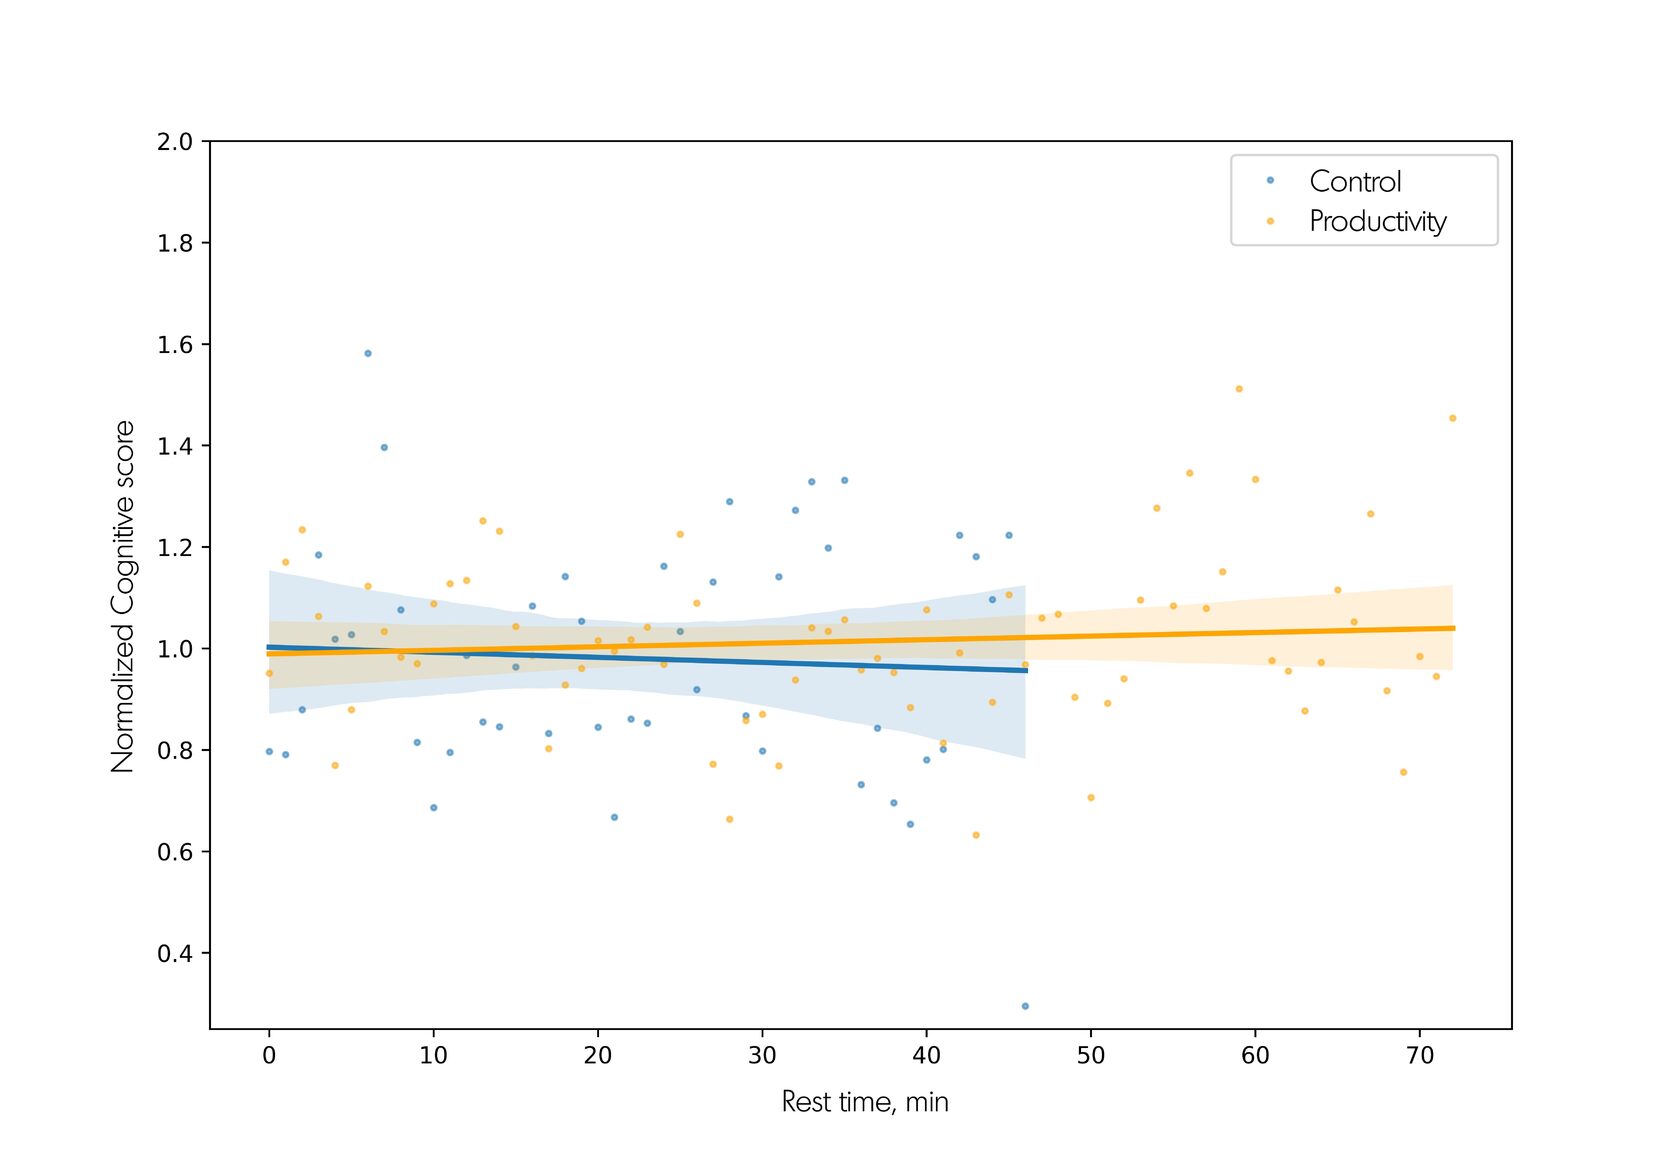
Figure 3. Changes in the cognitive score throughout the sequence of all work periods (A) and breaks (B). The dots represent the average group parameter values for each minute. The lines correspond to linear regression, the area around them, highlighted in color, represents the 95% confidence interval.
A significant increase in the cognitive score was detected for the work periods of the Productivity group (z=3.368, p<0.001). Furthermore, a comparison of the differences in the cognitive score (Fig. 4) within 5 minutes before and after the break showed a more pronounced decrease in this parameter for the Productivity group (Mann-Whitney test, z=12.0, p<0.05).
A significant increase in the cognitive score was detected for the work periods of the Productivity group (z=3.368, p<0.001). Furthermore, a comparison of the differences in the cognitive score (Fig. 4) within 5 minutes before and after the break showed a more pronounced decrease in this parameter for the Productivity group (Mann-Whitney test, z=12.0, p<0.05).
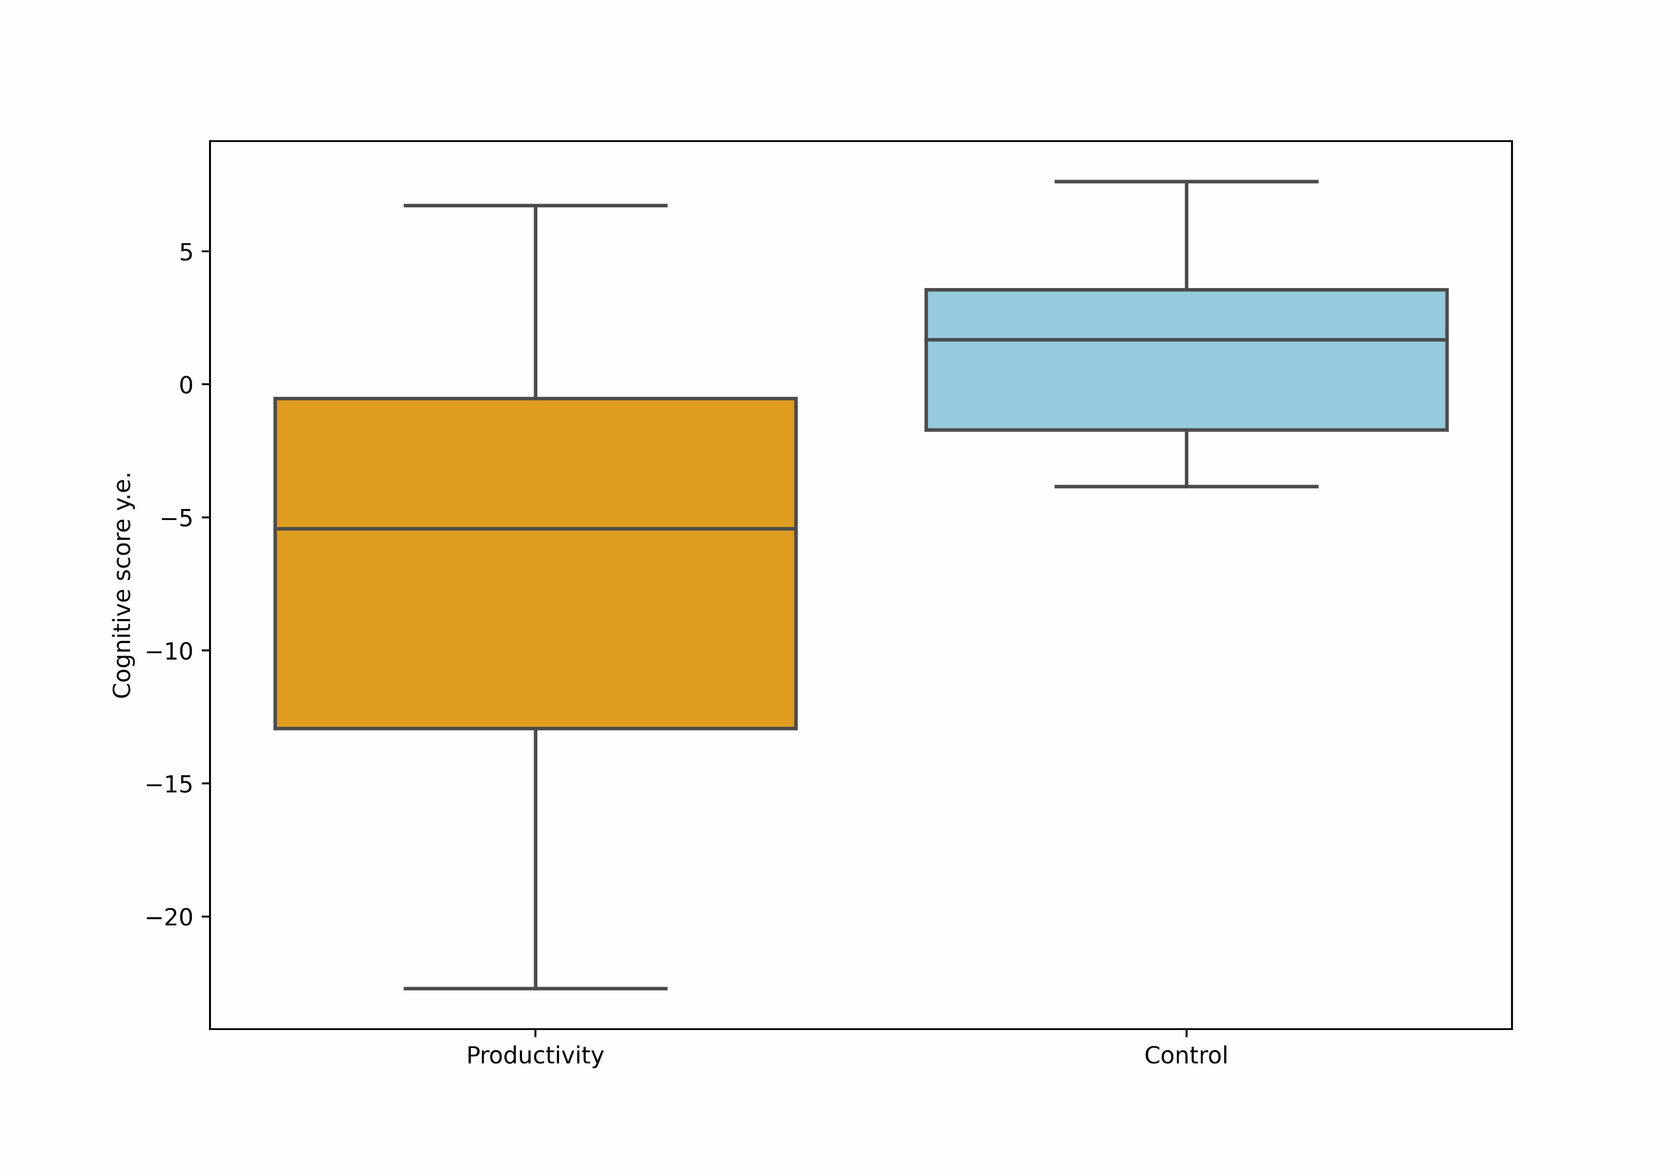
Figure 4. Comparison of changes in the cognitive score before/after the break for the control and Productivity groups. The y-axis represents the difference in the cognitive score in conventional units.
This result may indicate a more significant reduction in cognitive load during rest in the Productivity group, hence, its greater effectiveness.
Conclusion
Thus, organizing work process with the Productivity Mind tracker BCI allows reduced EEG indices associated with fatigue, as well as increased concentration on the work process, greater cognitive load during work and decreased cognitive load during rest. However, the answers of the participants revealed that subjective feelings about the need for a break differ significantly from the Productivity tool recommendations, based on EEG indicators. This may be related to the habit of working in a specific mode, which apparently is not optimal from the brain’s perspective. The absence of a timely break leads to the accumulation of fatigue and decrease in cognitive functions, which cannot be compensated for by a resting later and longer.
References
Bazanova, O. M., & Aftanas, L. I. (2008). Individual measures of electroencephalogram alpha activity and non-verbal creativity. Neuroscience and Behavioral Physiology, 38(3). https://doi.org/10.1007/s11055-008-0034-y
Bennett, A. A., Gabriel, A. S., & Calderwood, C. (2019). Examining the Interplay of Micro-Break Durations and Activities for Employee Recovery: A Mixed-Methods Investigation. Journal of Occupational Health Psychology. https://doi.org/10.1037/ocp0000168
Freeman, F. G., Mikulka, P. J., Prinzel, L. J., & Scerbo, M. W. (1999). Evaluation of an adaptive automation system using three EEG indices with a visual tracking task. Biological Psychology, 50(1). https://doi.org/10.1016/S0301-0511(99)00002-2
Grammer, J. K., Xu, K., & Lenartowicz, A. (2021). Effects of context on the neural correlates of attention in a college classroom. Npj Science of Learning, 6(1). https://doi.org/10.1038/s41539-021-00094-8
Jap, B. T., Lal, S., Fischer, P., & Bekiaris, E. (2009). Using EEG spectral components to assess algorithms for detecting fatigue. Expert Systems with Applications, 36(2 PART 1). https://doi.org/10.1016/j.eswa.2007.12.043
Jing, D., Liu, D., Zhang, S., & Guo, Z. (2020). Fatigue driving detection method based on EEG analysis in low-voltage and hypoxia plateau environment. International Journal of Transportation Science and Technology, 9(4), 366–376. https://doi.org/10.1016/J.IJTST.2020.03.008
Scholz, A., Ghadiri, A., Singh, U., Wendsche, J., Peters, T., & Schneider, S. (2018). Functional work breaks in a high-demanding work environment: an experimental field study. Ergonomics, 61(2). https://doi.org/10.1080/00140139.2017.1349938
Scholz, A., Wendsche, J., Ghadiri, A., Singh, U., Peters, T., & Schneider, S. (2019). Methods in experimental work break research: A scoping review. In International Journal of Environmental Research and Public Health (Vol. 16, Issue 20). https://doi.org/10.3390/ijerph16203844
